Yair Benita

Computational Biology Bioinformatics Genomics

Developing integrative approaches to analyze gene lists from high-throughput screens, expression profiling, and genome-wide association studies — placing genes into biological context through enrichment analysis, protein networks, and process mapping.

Iterative Gene Enrichment Analysis

A next-generation web tool for gene set enrichment analysis — supporting both standard over-representation analysis and a novel iterative mode.

✦ Live on Streamlit

iGEA: Smarter Enrichment

iGEA performs both standard over-representation analysis (ORA) and an innovative iterative enrichment mode that progressively removes the most significant gene sets to uncover deeper biological signals — the same strategy used in my HIV screen analysis to discover autophagy's role in HIV infection.

Iterative Mode Removes top hits iteratively to reveal hidden biology
MSigDB v2025.1 12 pre-loaded gene set libraries from Broad Institute
Network Visualization Interactive gene-term network graphs
Smart Validation Auto-converts Entrez IDs, fixes outdated symbols
Multiple Tests Fisher's Exact, Hypergeometric, Chi-Squared
Export & Share Download as TSV, JSON, or combined archives
🚀 Launch App ⌂ GitHub Repository
💡 HIV connection: The iterative enrichment concept in iGEA grew directly from the self-organizing network strategy I developed for the HIV screen — where removing the most significant cluster at each step revealed successively deeper biological processes, including autophagy.

Analyzing Gene Lists from High-Throughput Screens

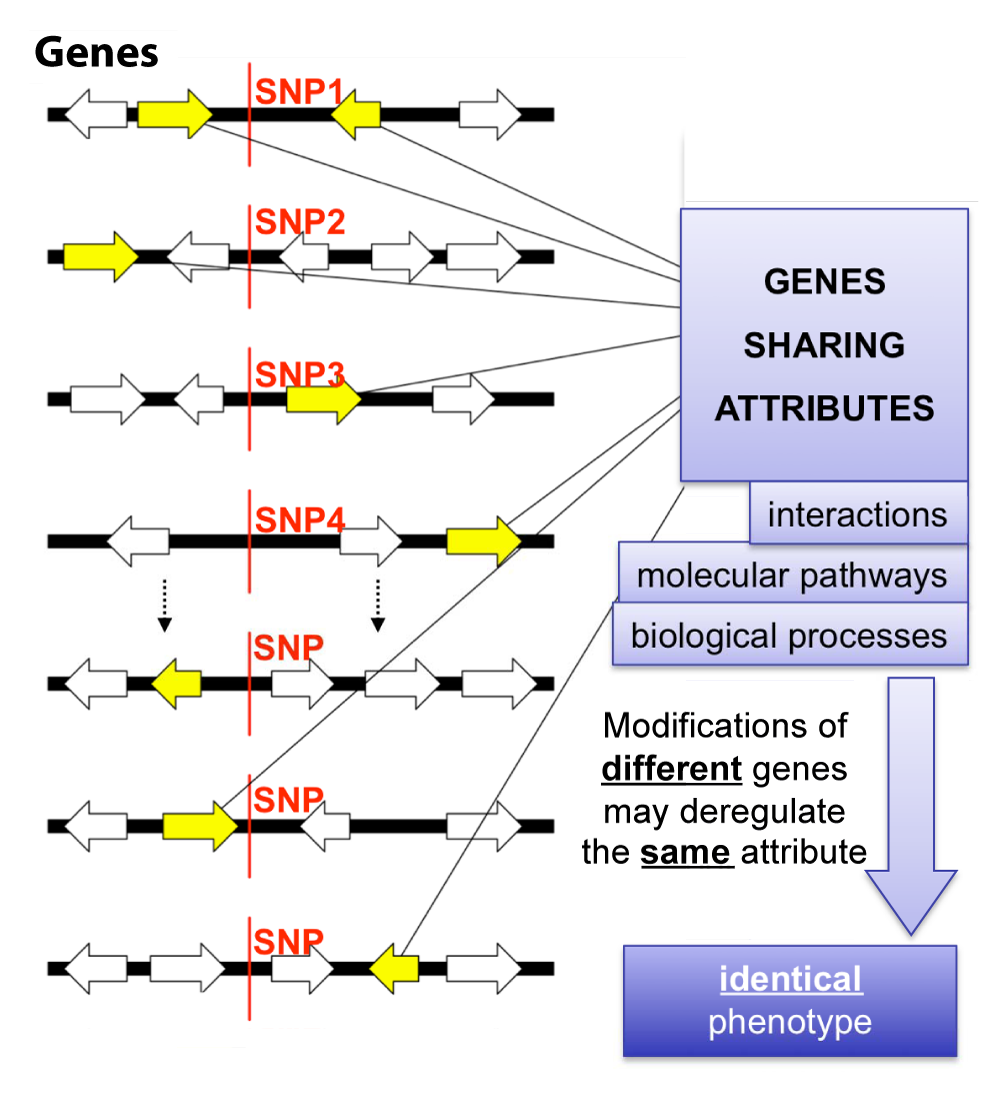
Gene lists from siRNA screens, microarray experiments, GWAS, and proteomics can be analyzed using two complementary approaches — placing genes into known biology, or discovering new biology through networks.

🗄️

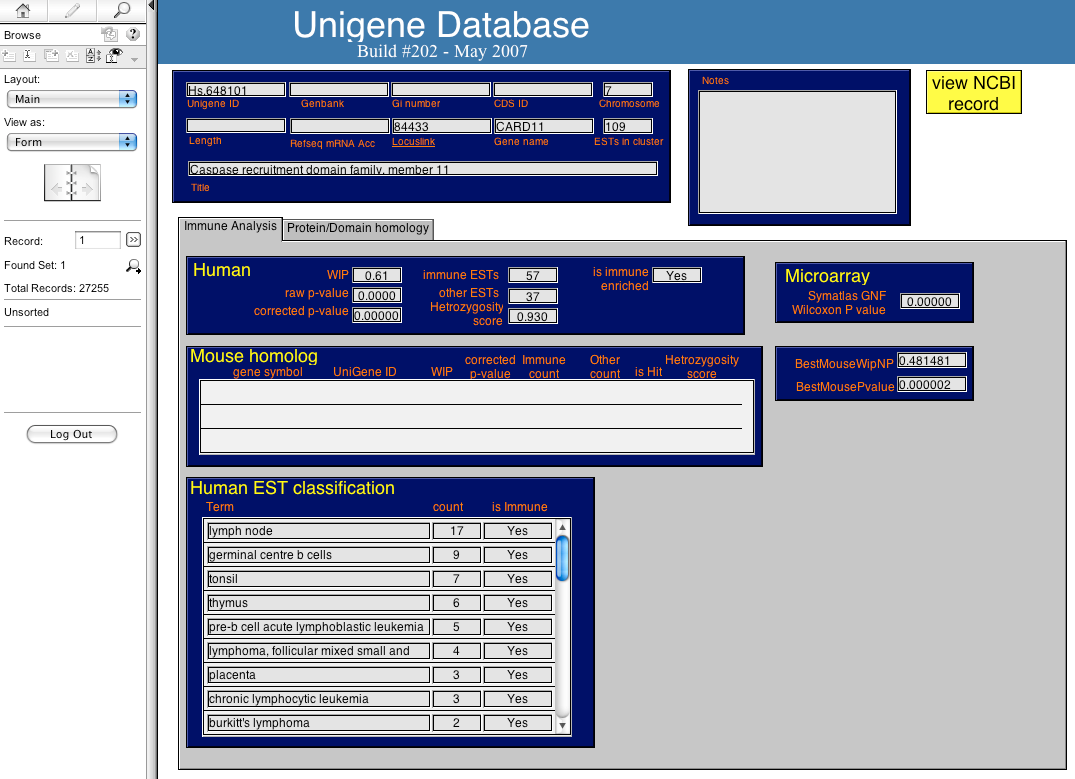
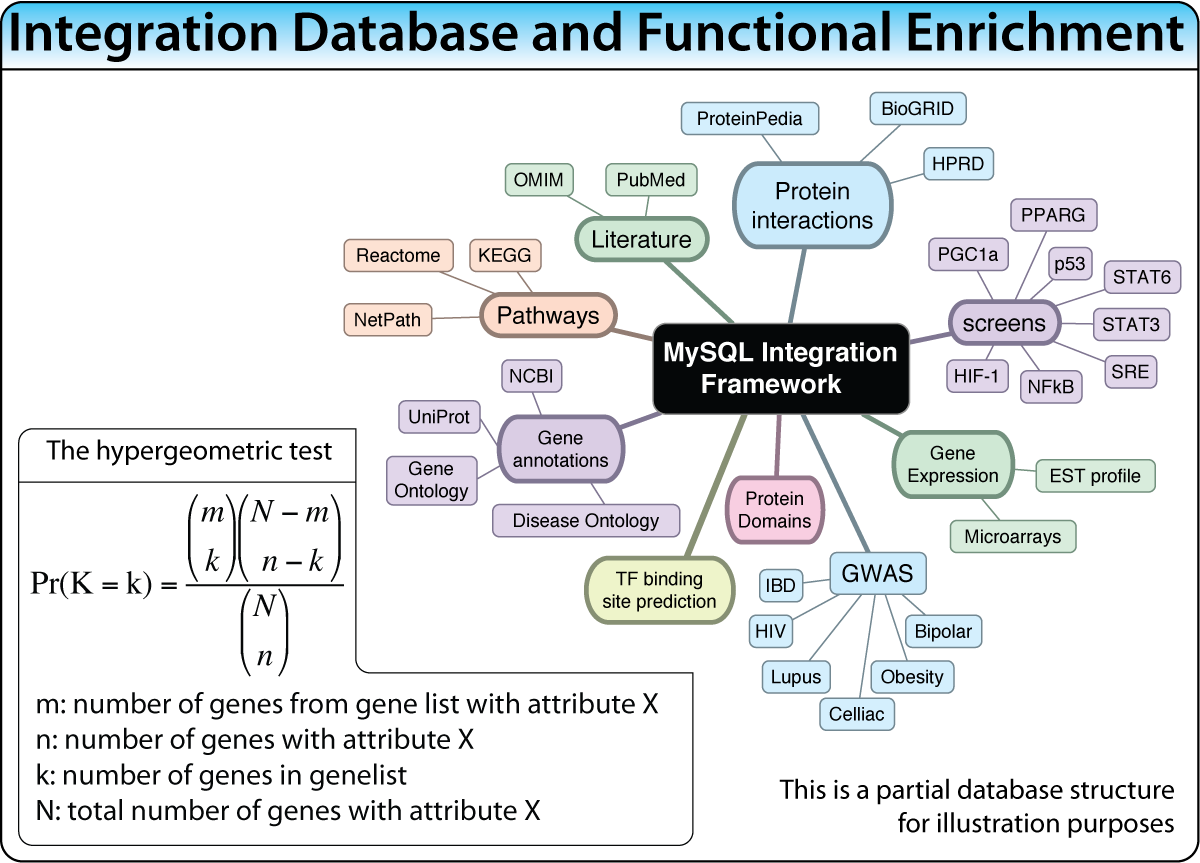
MySQL Integration Database

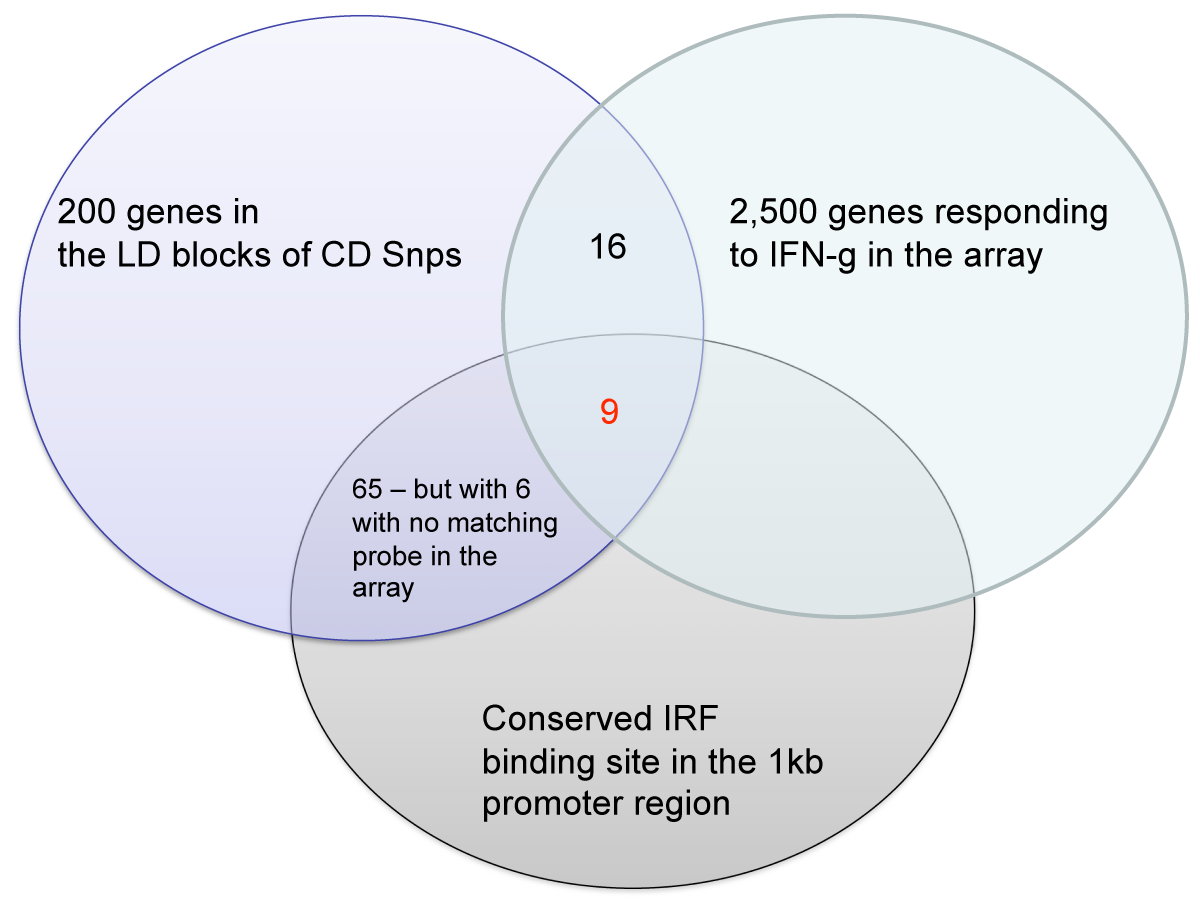
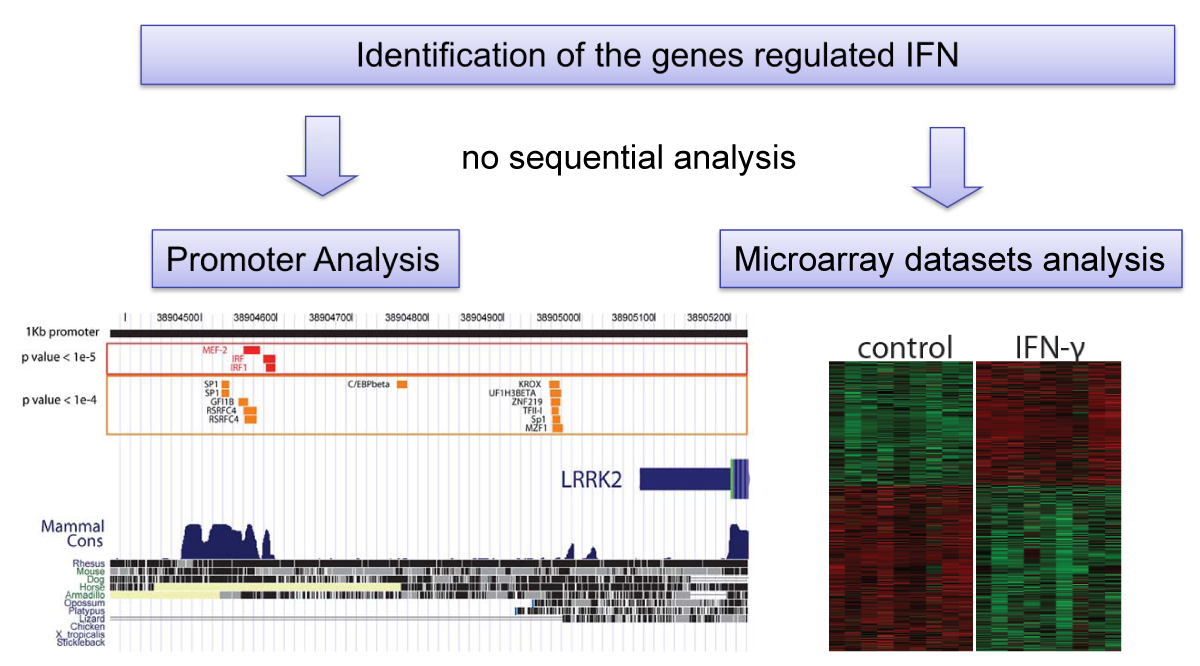
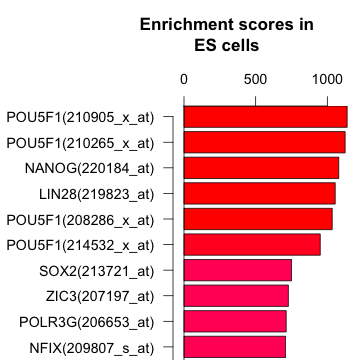
A gene-centric database framework that supports enrichment analysis and gene-gene interaction discovery. It integrates annotation from multiple sources: protein interactions, microarray expression profiles, co-citation data, transcription factor binding sites, and high-throughput screen results. Enrichment p-values are calculated using the hypergeometric distribution.

Integration Database Schema
📍

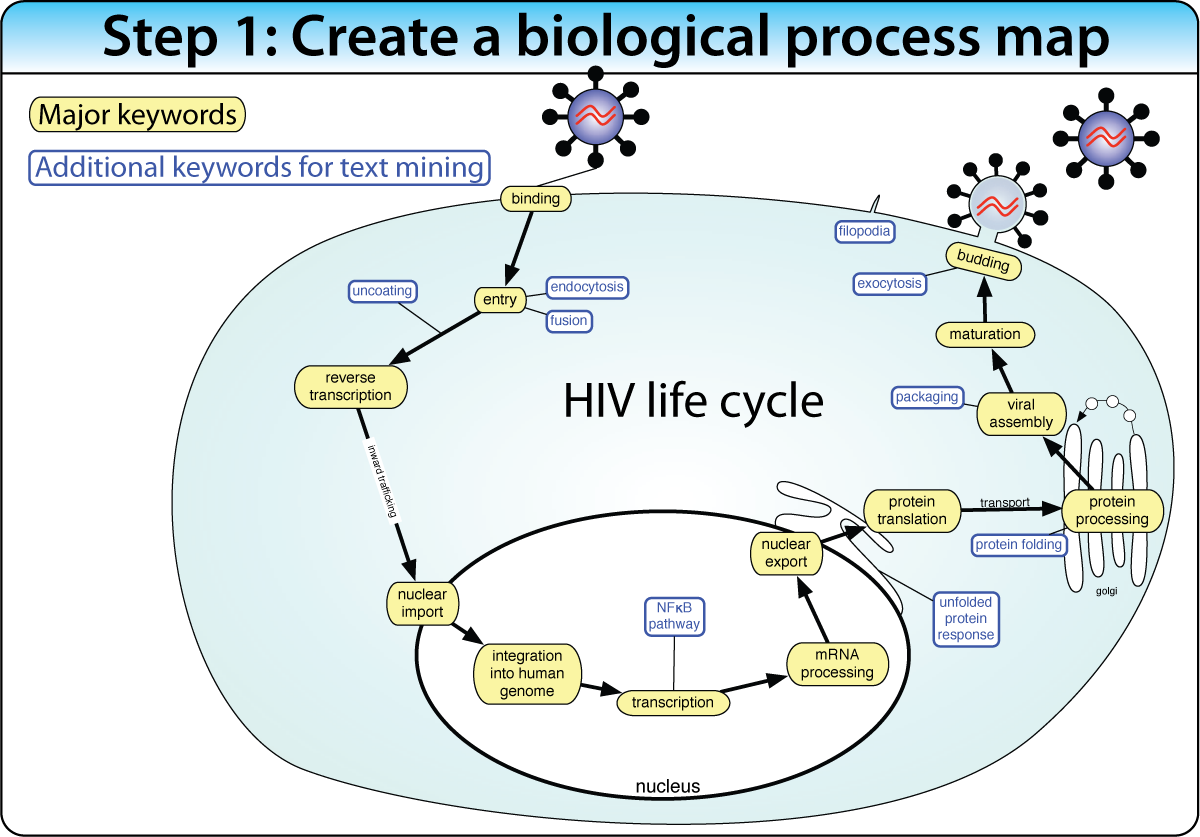
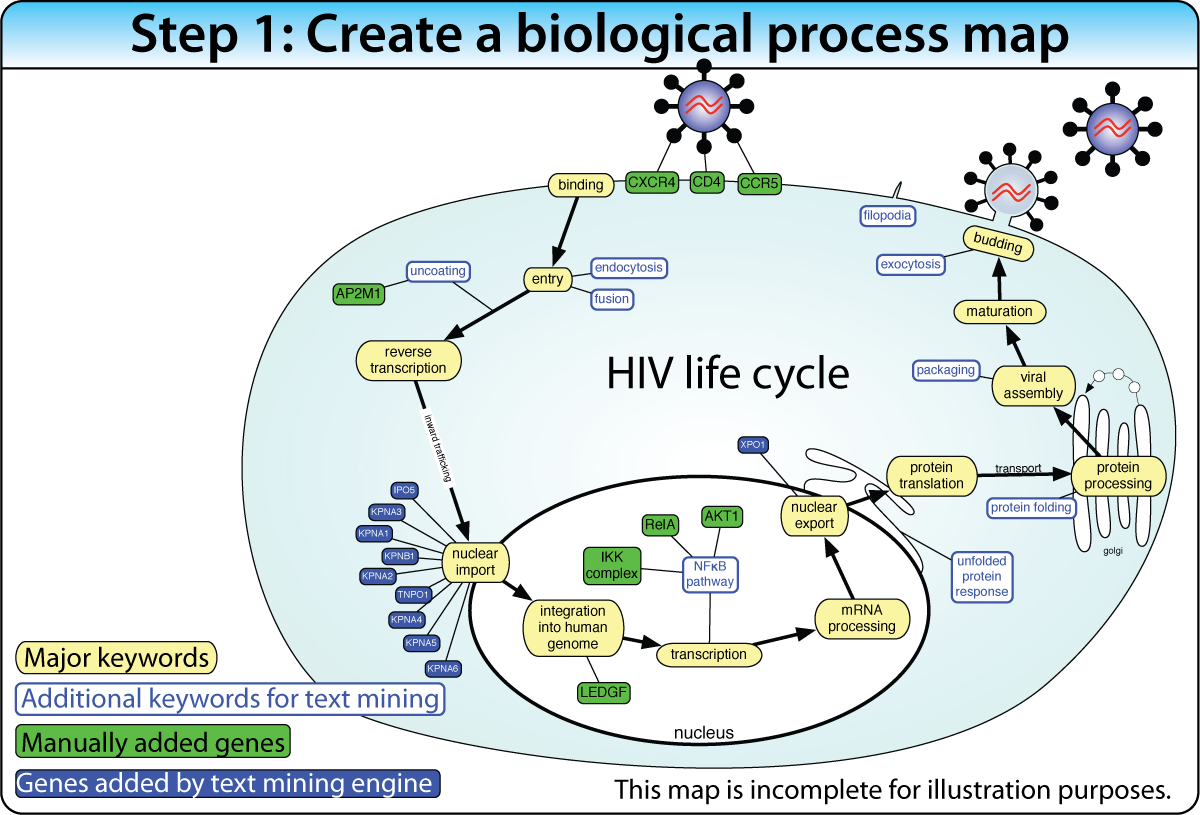
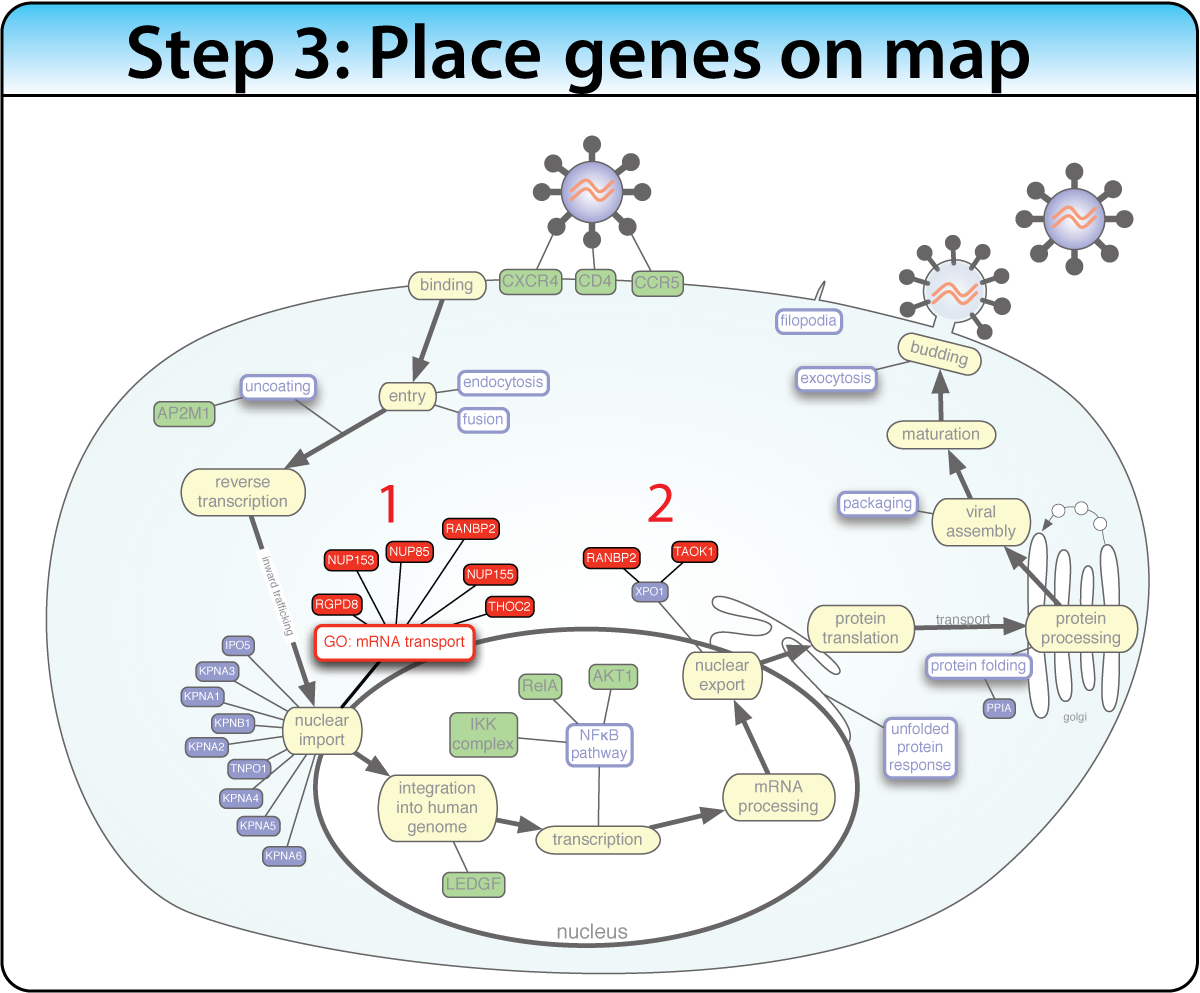
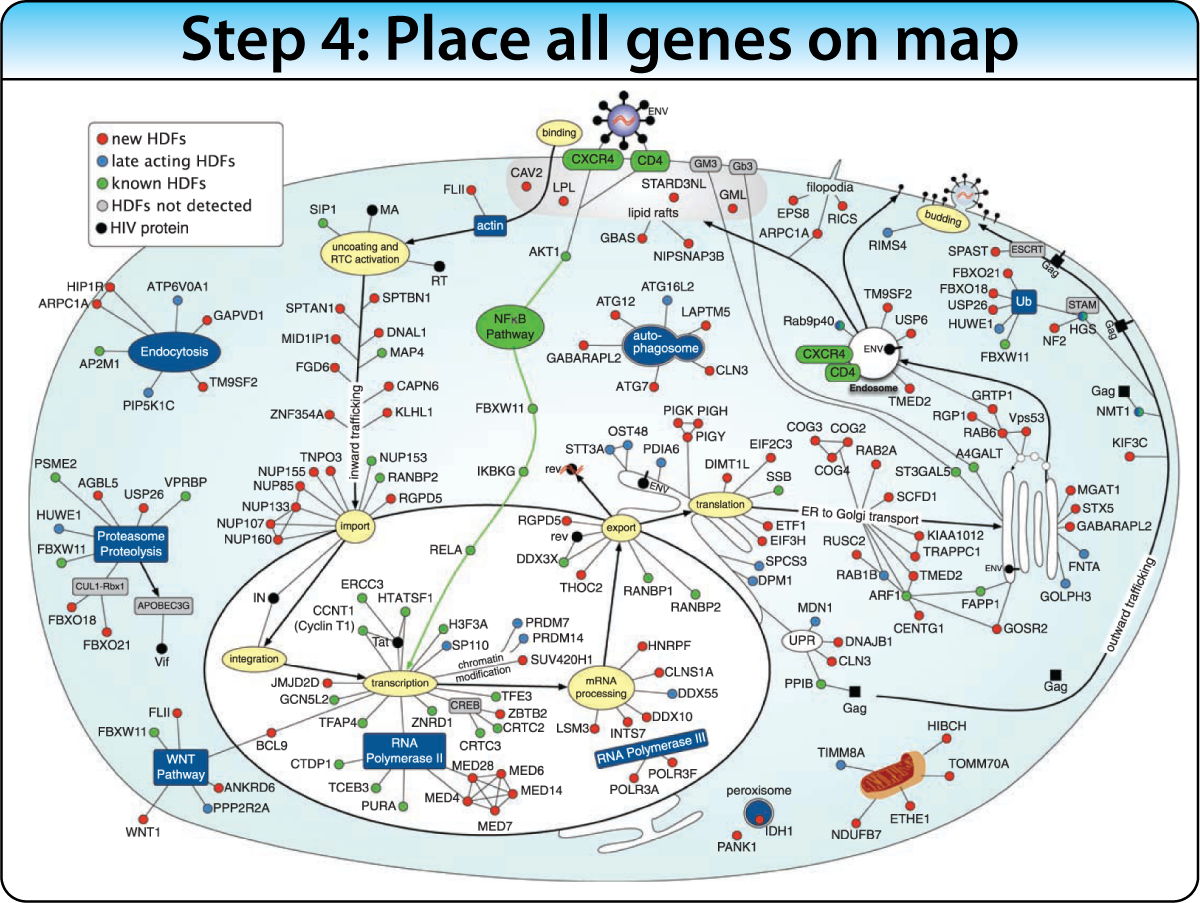
Supervised: Biological Process Mapping

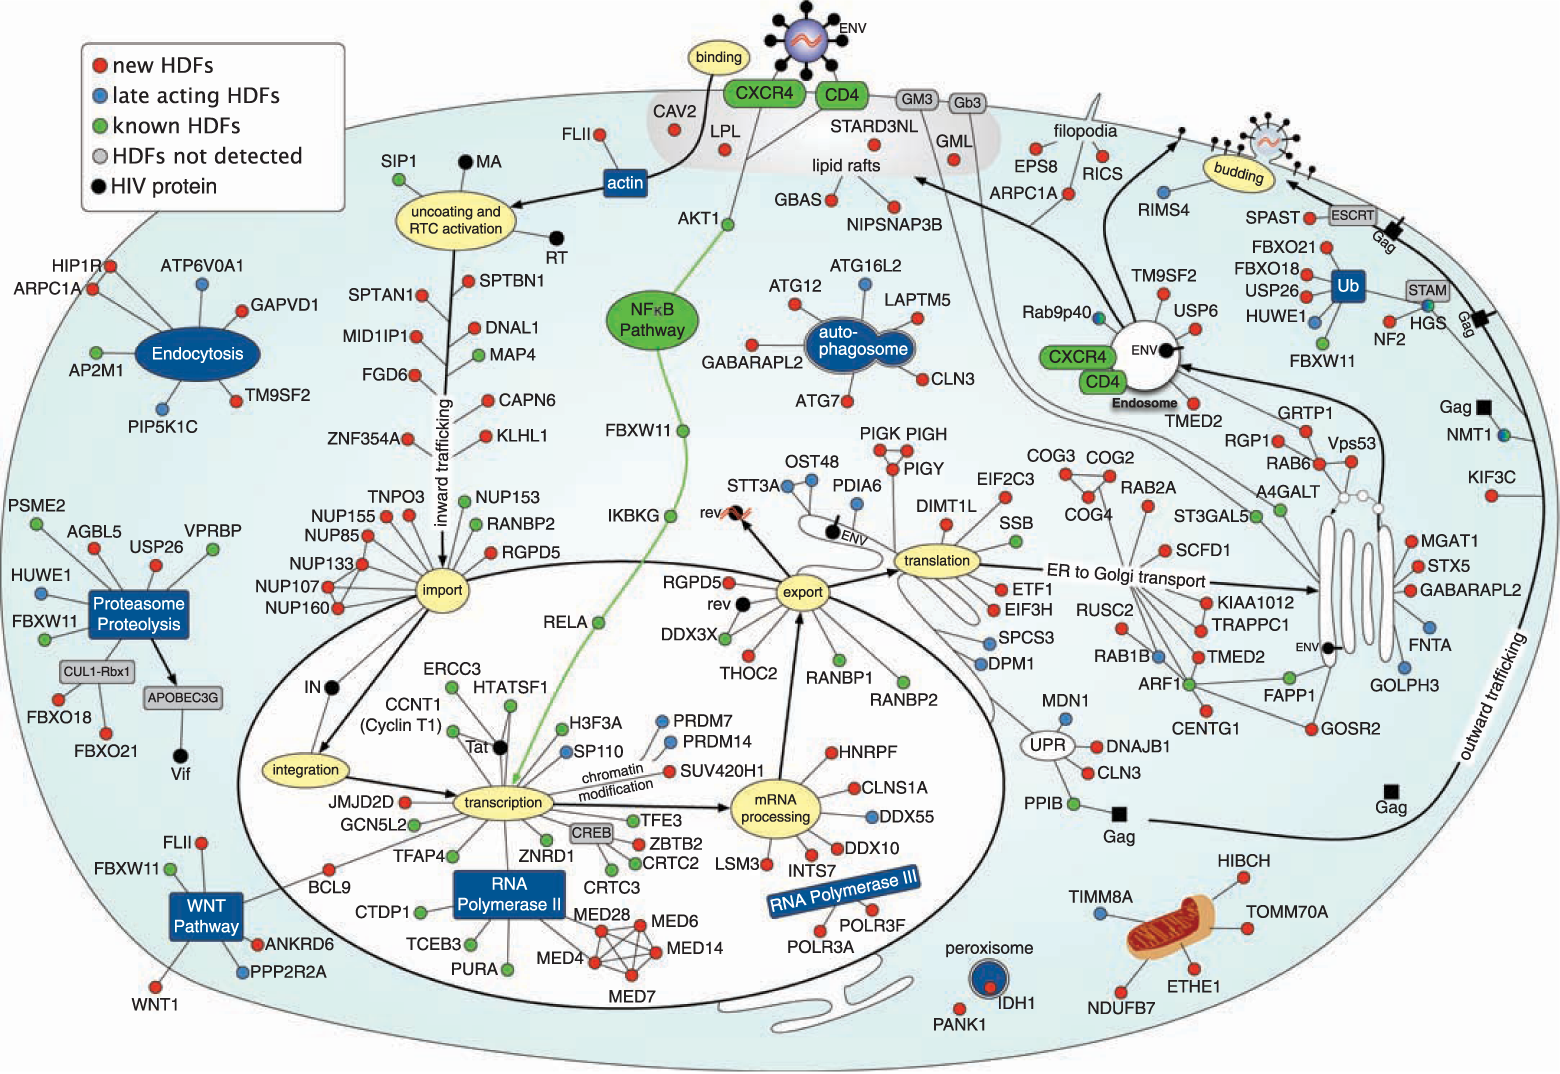
Construct a biological process map of connected keywords and genes before the screen. Then place screen hits into the map using enrichment analysis and protein interactions. This approach works best when the biological pathway is well characterized.

Example: Mapping 160+ genes into the HIV life cycle — from receptor binding through nuclear import to budding — using enrichment of Gene Ontology terms, protein interactions, and text mining.

🕸️

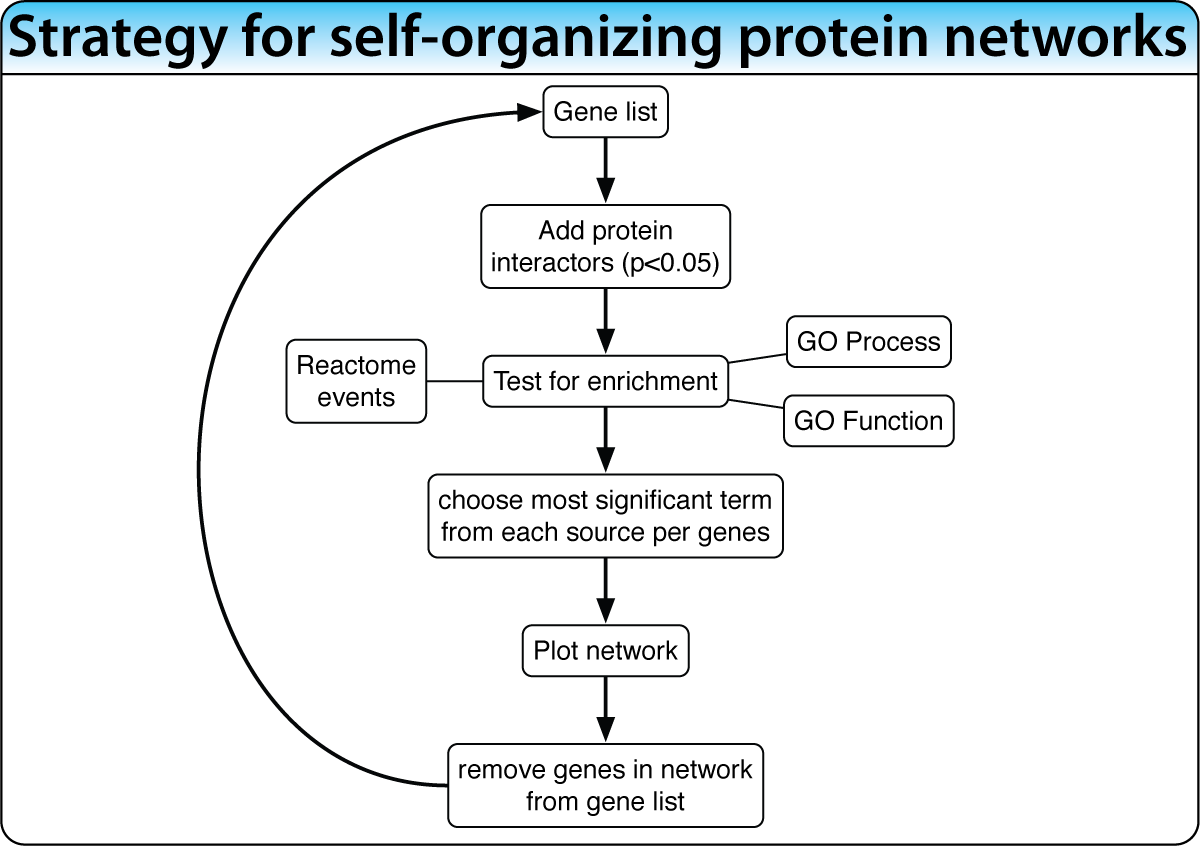
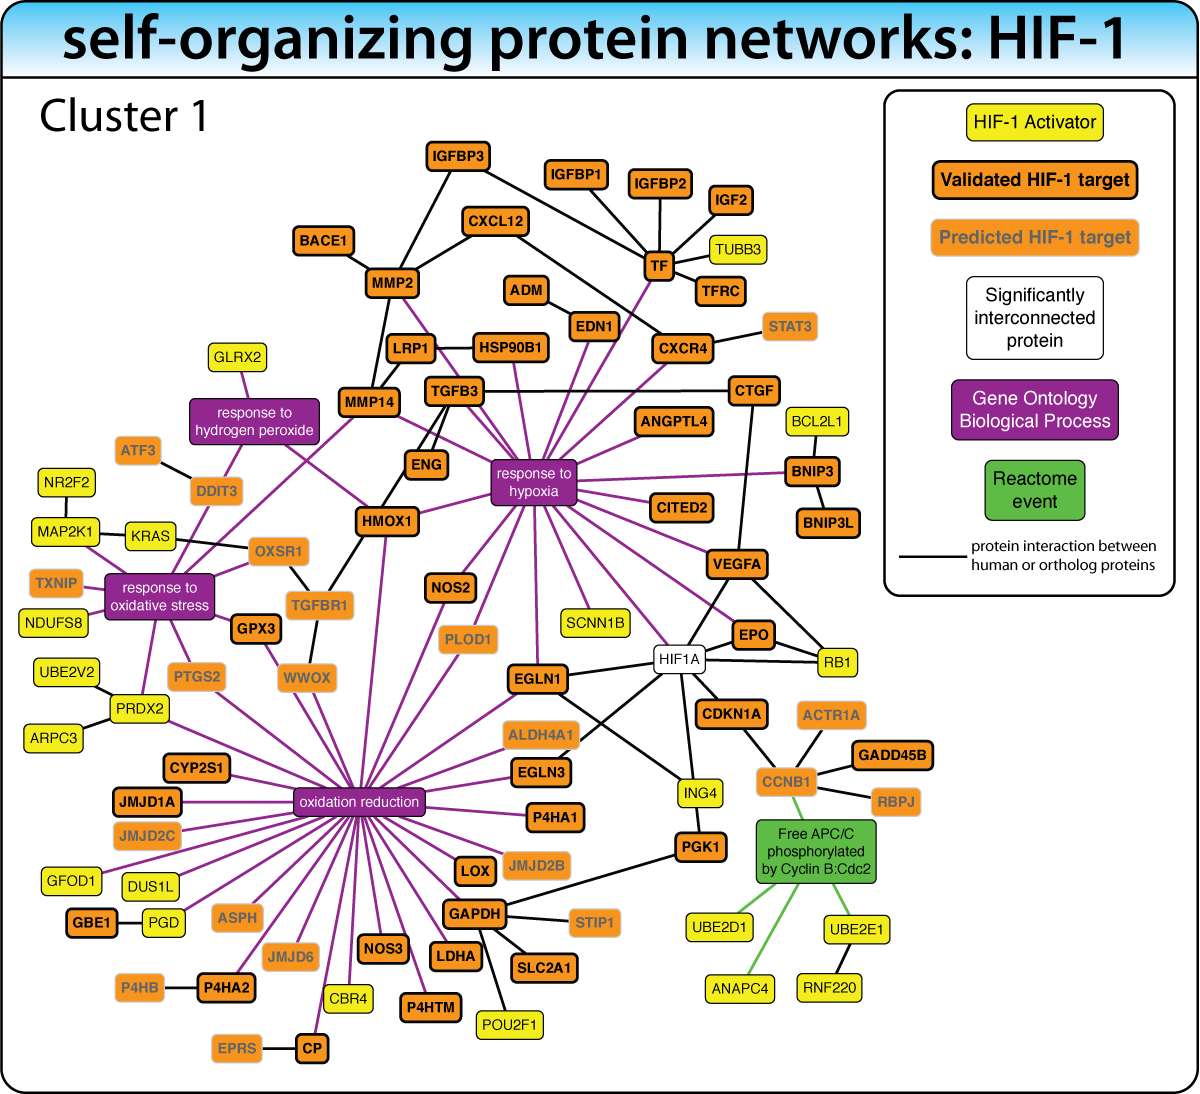
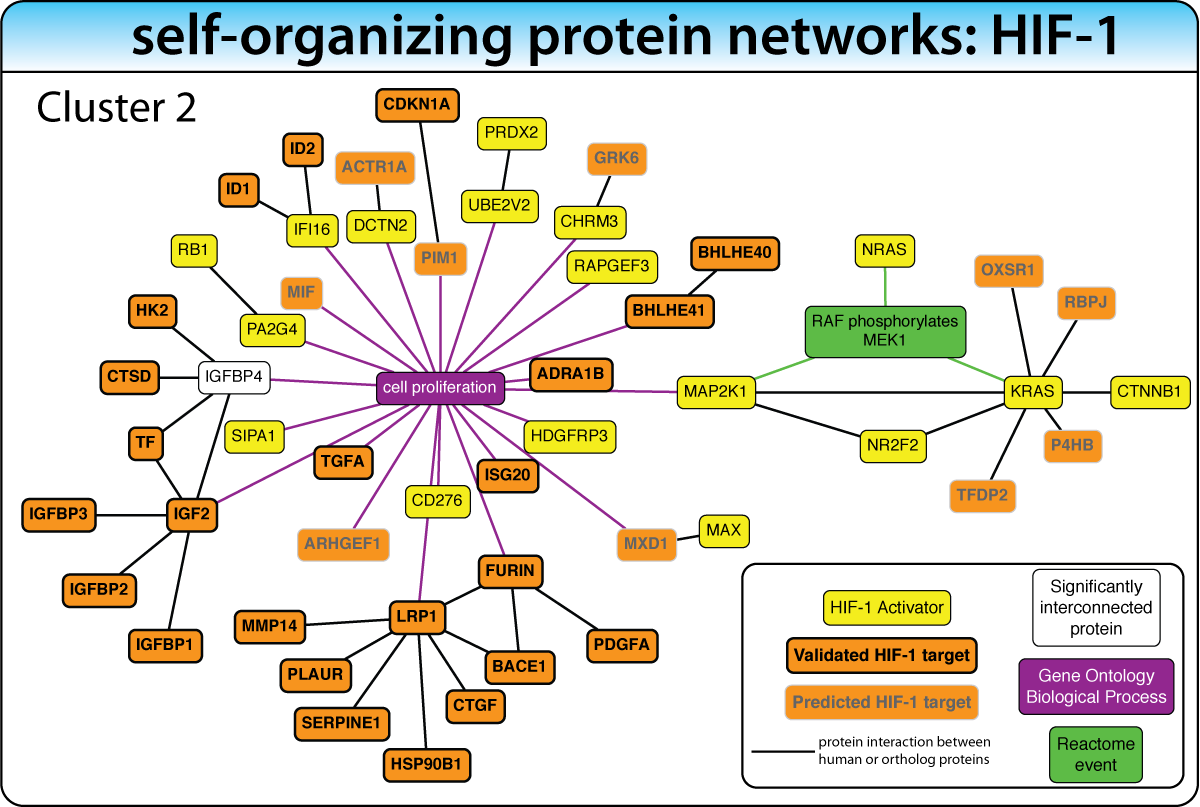
Unsupervised: Self-Organizing Networks

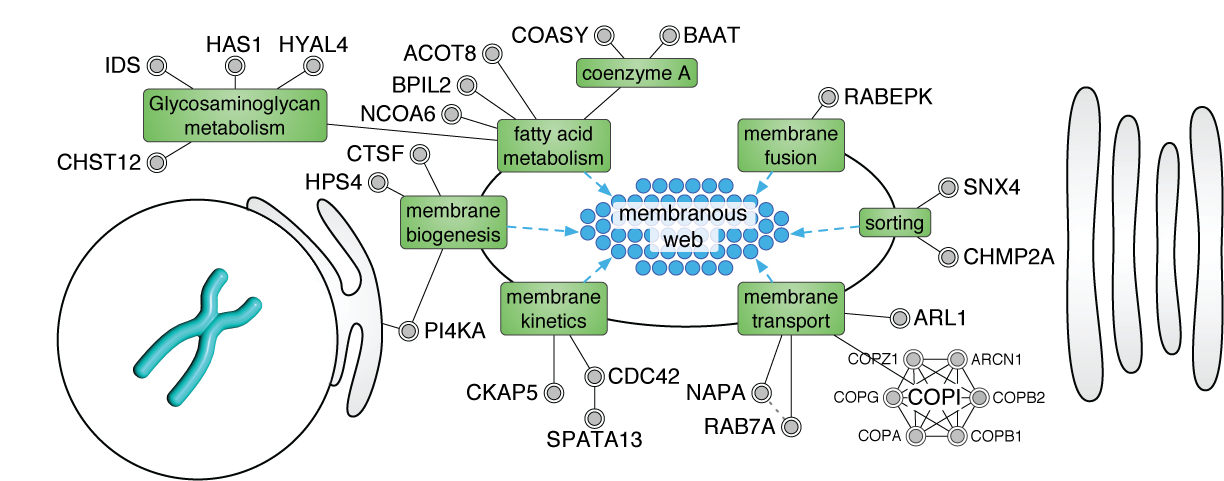
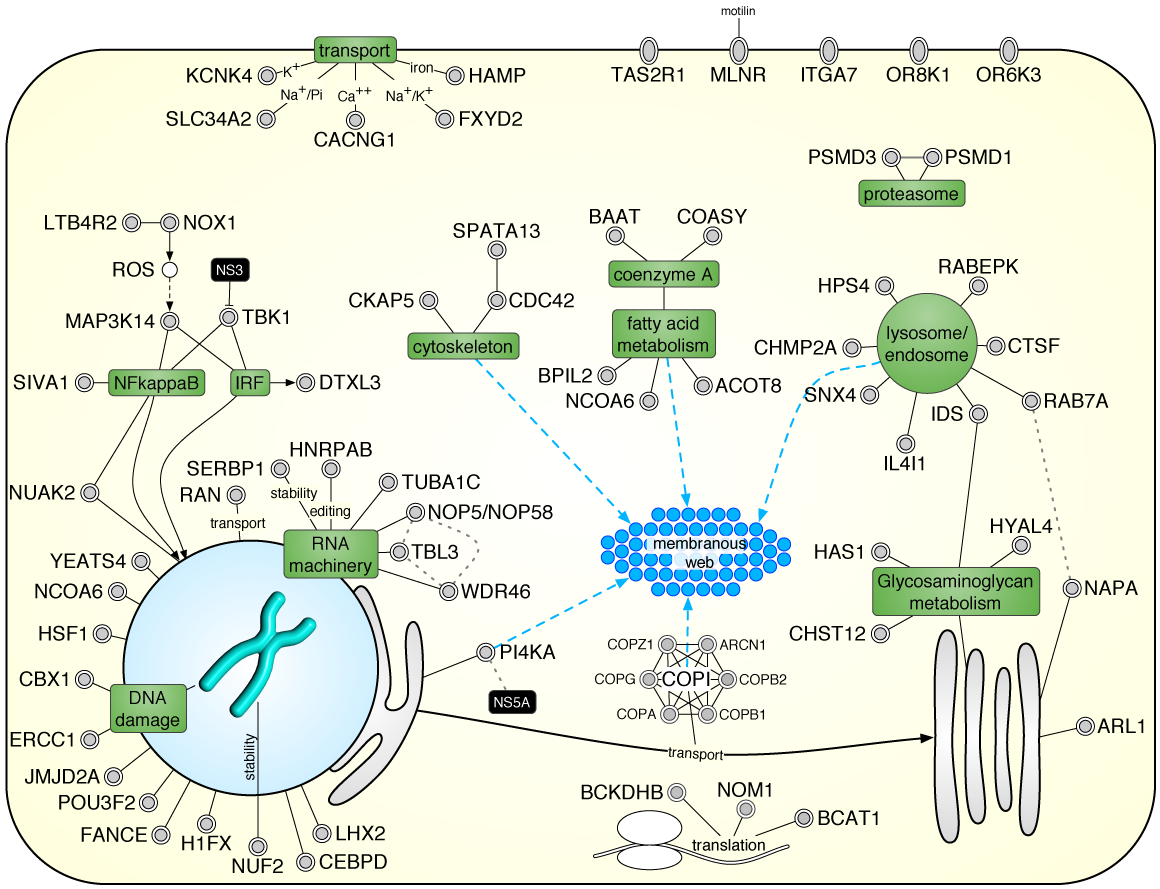
When the biological process is not well characterized, expand the gene list with enriched interacting proteins, then iteratively extract the most significant network cluster. Remove it and repeat to discover successively deeper biology.

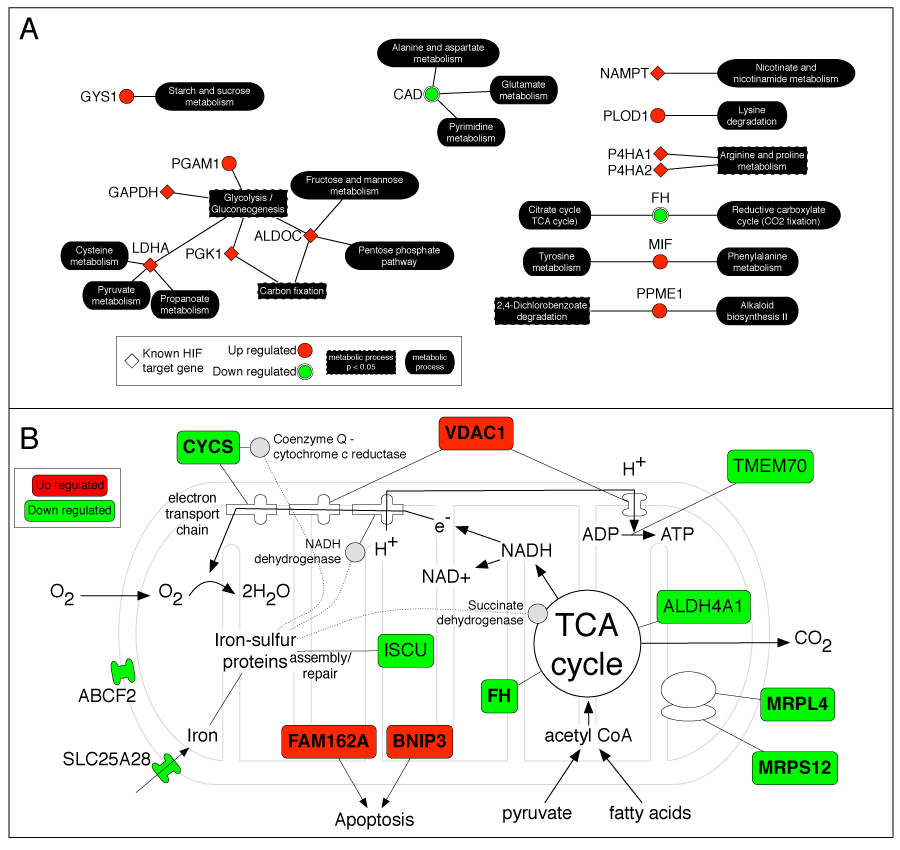
Example: In the HIF-1 screen, this strategy — biased with keywords like "hypoxia" and "oxygen" — revealed clusters for hypoxic response, cell proliferation, and metabolic reprogramming. This iterative concept is now implemented in iGEA.

HIV Host Dependency Factor Screen

An siRNA screen identifying genes required for HIV infection — published in Science, 2008. Over 160 host dependency factors were placed into a comprehensive map of the viral life cycle.

🦠

Building the HIV Life Cycle Map

Brass et al. · Science · 2008

Step 1

Define the Biological Process Map

Construct a map of the viral life cycle before the screen. This captures the current state of knowledge — from receptor binding through nuclear import, integration, transcription, and budding.

Biological process map — step 1
Step 2

Add Known Genes (Manual + Text Mining)

Add genes previously known to play a role — manually (e.g., CD4, CXCR4, CCR5 for viral entry) or automatically via a text mining engine. Each text-mined gene is supported by at least 3 independent publications.

Biological process map — step 2
Step 3

Place Screen Hits via Enrichment & Interactions

Screen hits are placed into the map using the integrative database: enrichment analysis identifies relevant categories (e.g., "mRNA transport" — 6 genes, the most significant term), and protein interactions link individual genes (e.g., RANBP2 and TAOK1 interact with XPO1 in nuclear export).

Biological process map — step 3
Step 4

Complete Map

The process continues until all possible genes are placed. The final manuscript figure shows the complete HIV life cycle with host dependency factors (HDFs) mapped to each step.

Complete HIV life cycle map

Complete Manuscript Figure

HIV cell with host dependency factors

HIV cell with mapped host dependency factors — click to enlarge

Remaining Genes: Off-Targets or Extremely Interesting?

Genes that could not be placed on the map fall into three categories:

1
Unexpected enrichment. 6 of 30 known autophagy genes scored — far beyond chance. Autophagy was not previously linked to HIV, but subsequent studies confirmed its relevance.
2
High-confidence candidates. ADAM10 scored 4/4 siRNAs, is enriched in macrophages, and its promoter contains conserved immune-related binding sites (ETS1, SPI1 — conserved across 13 species).
3
Likely false positives. Several olfactory receptors scored with only 1/4 siRNAs, are expressed in the CNS, and are annotated as sensory receptors — inconsistent with HIV biology.
📄 Manuscript (PDF) 📎 Supplementary (PDF)

Hepatitis C Replication Screen

siRNA screen identifying genes required for Hepatitis C replication — published in Cell Host & Microbe.

🔬

Discovering the Membranous Web

Cell Host & Microbe

Viral Replication Depends on Membrane Reorganization

The analysis revealed that the main process on which viral replication depends is the formation of the membranous web — a reorganization of intracellular membranes that creates the replication compartment. This fundamental mechanism became the central insight of the study.

HCV membranous web Membranous web — manuscript figure

Complete Cell Overview

HCV cell overview

HCV cell — supplementary figure

📄 Manuscript (PDF) 📎 Supplementary (PDF)

HIF-1 Activation Screen & Self-Organizing Networks

Luciferase-based screen for genes that activate HIF-1, combined with a strategy to predict HIF-1 downstream targets. Published in Nucleic Acids Research.

🧪

Self-Organizing Network Strategy

300 HIF-1 activators + 107 validated targets + 174 predicted targets

Iterative Cluster Extraction

Since many genes are poorly annotated, the gene list is first expanded with significantly enriched interacting proteins. The expanded list is then tested for enrichment, and the largest significant cluster is extracted. This cluster is removed, and the process iterates — exactly the strategy now available in iGEA's iterative mode.

Self-organizing network strategy Iterative strategy overview

Cluster 1: Hypoxia & Oxygen Response

The first and strongest cluster captures the expected hypoxic response — biased with keywords like "hypoxia" and "oxygen." Removing this cluster allows the algorithm to discover deeper, less obvious biology in subsequent iterations.

HIF-1 cluster 1 — hypoxia Cluster 1: Hypoxia / Oxygen (biased)

Cluster 2: Cell Proliferation

After removing the hypoxia cluster, the next most significant cluster reveals cell proliferation — a known but less obvious connection to HIF-1 signaling, demonstrating how iterative extraction uncovers layered biology.

HIF-1 cluster 2 — proliferation Cluster 2: Cell Proliferation

HIF-1 Target Prediction — Metabolic Pathways

HIF-1 metabolic pathway map

Predicted targets placed into metabolic pathways and mitochondria. Green = down-regulated · Red = up-regulated

📄 Manuscript (PDF) 📊 Figures (PDF) 📎 Supplementary Figures (PDF)

GWAS: Crohn's Disease Gene Analysis

Using integrative analysis to identify causal genes across 30 GWAS loci. PubMed

🧬

From 200 Candidates to 9 Genes

Meta-analysis study · 30 loci · 200+ candidate genes

Multi-Locus Linking Strategy

The 2007 GWAS meta-analysis of Crohn's disease identified 30 loci with over 200 candidate causal genes. The strategy was to find shared attributes linking genes across multiple loci — and to look for disease-relevant responses to IFNγ (the hallmark cytokine of Crohn's disease) and NFκB activation.

GWAS analysis strategy Multi-locus linking strategy

IFNγ Response Meets IRF Binding Sites

By intersecting genes that respond to IFNγ stimulation with those harboring conserved IRF binding sites in their proximal promoters, the field of 200+ candidates was narrowed to just 9 genes — a dramatic reduction pointing to the most likely causal factors.

IFNgamma and TFBS intersection IFNγ response + IRF binding site intersection

LRRK2: From Parkinson's to Crohn's

Among the 9 genes: NOD2, CYLD, and LRRK2. LRRK2 was previously known only for Parkinson's disease but was subsequently validated as IRF-responsive in macrophages — confirming the prediction and revealing an unexpected connection between two diseases.

LRRK2 validation LRRK2 validated as IRF-responsive in macrophages

Annotation-Independent Analysis Tools

Tools that provide functional clues for genes without relying on existing annotations — using expression profiling, EST counting, and promoter analysis.

📊

Gene Enrichment Atlas

Gene expression profiles across 126 primary cells and tissues with a novel enrichment scoring system. Unlike expression levels, this tissue-specificity score is comparable between genes, enabling gene ranking within each tissue.

Key finding: The top 4 scoring genes in embryonic stem cells — POU5F1 (OCT4), SOX2, NANOG, and LIN28 — were independently identified as sufficient to reprogram human somatic cells to pluripotent stem cells.

🔎

Immune Atlas (EST-based)

Compiled from over 7 million human Expressed Sequence Tags to identify genes enriched in the immune system. Provides tissue-level expression evidence independent of microarray platforms.

🎯

Proximal Promoter TFBS Prediction

Identifies transcription factor binding sites in proximal promoters, providing clues to the stimuli that regulate a gene. Conservation across multiple species is used as evidence, with p-values calculated relative to flanking regions.

Validated predictions: ANKRD37 confirmed as a HIF-1 target; LRRK2 confirmed as an IRF target in the GWAS analysis.

Doctoral Thesis

Thesis cover

An Integrative Approach to Analyze Genes from High-Throughput Screens

This thesis describes the complete framework: the integration database, the supervised process-mapping approach, the unsupervised self-organizing network strategy, and annotation-independent tools — applied to HIV, HCV, and HIF-1 screens.

📥 Download Thesis (PDF)